Why Kalkine ?
Empower your Decisions through Kalkine’s Tech-Driven Stock Research

Professionally Managed

Performance Transparency

Loading market ticker...

Empower your Decisions through Kalkine’s Tech-Driven Stock Research
Entry Price:
Entry Price:
Entry Price:
Entry Price:
| Ticker | Name | Price(INR) | Change(INR) | %Change |
|---|---|---|---|---|
| ELGIRUBCO | Elgi Rubber Company Ltd. | 55.18 | 9.10 |
 Uptrend
19.75%
Uptrend
19.75%
|
| IKIO | IKIO Technologies Ltd. | 191.65 | 21.41 |
Uptrend
12.58%
|
| DIGITIDE | Digitide Solutions Ltd. | 99.65 | 11.05 |
Uptrend
12.47%
|
| INDOFARM | Indo Farm Equipments Ltd. | 163.10 | 17.16 |
Uptrend
11.76%
|
| SUVEN | Suven Life Sciences Ltd. | 331.40 | 33.45 |
Uptrend
11.23%
|
Data Powered by Accord Fintech
| Ticker | Name | Price(INR) | Change(INR) | %Change |
|---|---|---|---|---|
| RAJVIR | Rajvir Industries Ltd. | - | -6.86 |
 Downtrend
100.00%
Downtrend
100.00%
|
| POWERINDIA | Hitachi Energy India Ltd. | 31360.00 | -2415.0 |
Downtrend
7.15%
|
| POLICYBZR | PB Fintech Ltd. | 1562.00 | -120.1 |
Downtrend
7.14%
|
| VOGL | Vedanta Oil and Gas Ltd. | 41.42 | -3.17 |
Downtrend
7.11%
|
| VEDPOWER | Vedanta Power Ltd. | 45.20 | -3.44 |
Downtrend
7.07%
|
Data Powered by Accord Fintech
| Ticker | Name | Price(INR) | Change(INR) | %Change |
|---|---|---|---|---|
| YASHO | YASHO INDUSTRIES ORD (BSE) | 3858.7 | 643.10 |
Uptrend
20.00%
|
| ESAFSFB | ESAF Small Finance Bank | 42.7 | 6.22 |
Uptrend
17.05%
|
| SCPL | Sheetal Cool Products Limited | 615.0 | 63.85 |
Uptrend
11.58%
|
| DEEPINDS | Deep Industries Limited | 598.0 | 49.20 |
Uptrend
8.97%
|
| BAJFINANCE | Bajaj Finance Limited | 1141.2 | 83.20 |
Uptrend
7.86%
|
Data Powered by EOD Historical Data (“EODHD”)
| Ticker | Name | Price(INR) | Change(INR) | %Change |
|---|---|---|---|---|
| NUCLEUS | Nucleus Software Exports Limited | 683.1 | -55.05 |
Downtrend
7.46%
|
| APTUS | Aptus Value Housing Finance India Limited | 260.5 | -16.7 |
Downtrend
6.02%
|
| SAPPHIRE | Sapphire Foods India Limited | 184.45 | -10.8 |
Downtrend
5.53%
|
| ALLDIGI | Alldigi Tech Limited | 810.6 | -44.5 |
Downtrend
5.20%
|
| GOCOLORS | Go Fashion (India) Limited | 325.85 | -17.15 |
Downtrend
5.00%
|
Data Powered by EOD Historical Data (“EODHD”)
Elevate your Investment Experience with Kalkine’s Expert Research and Analytics
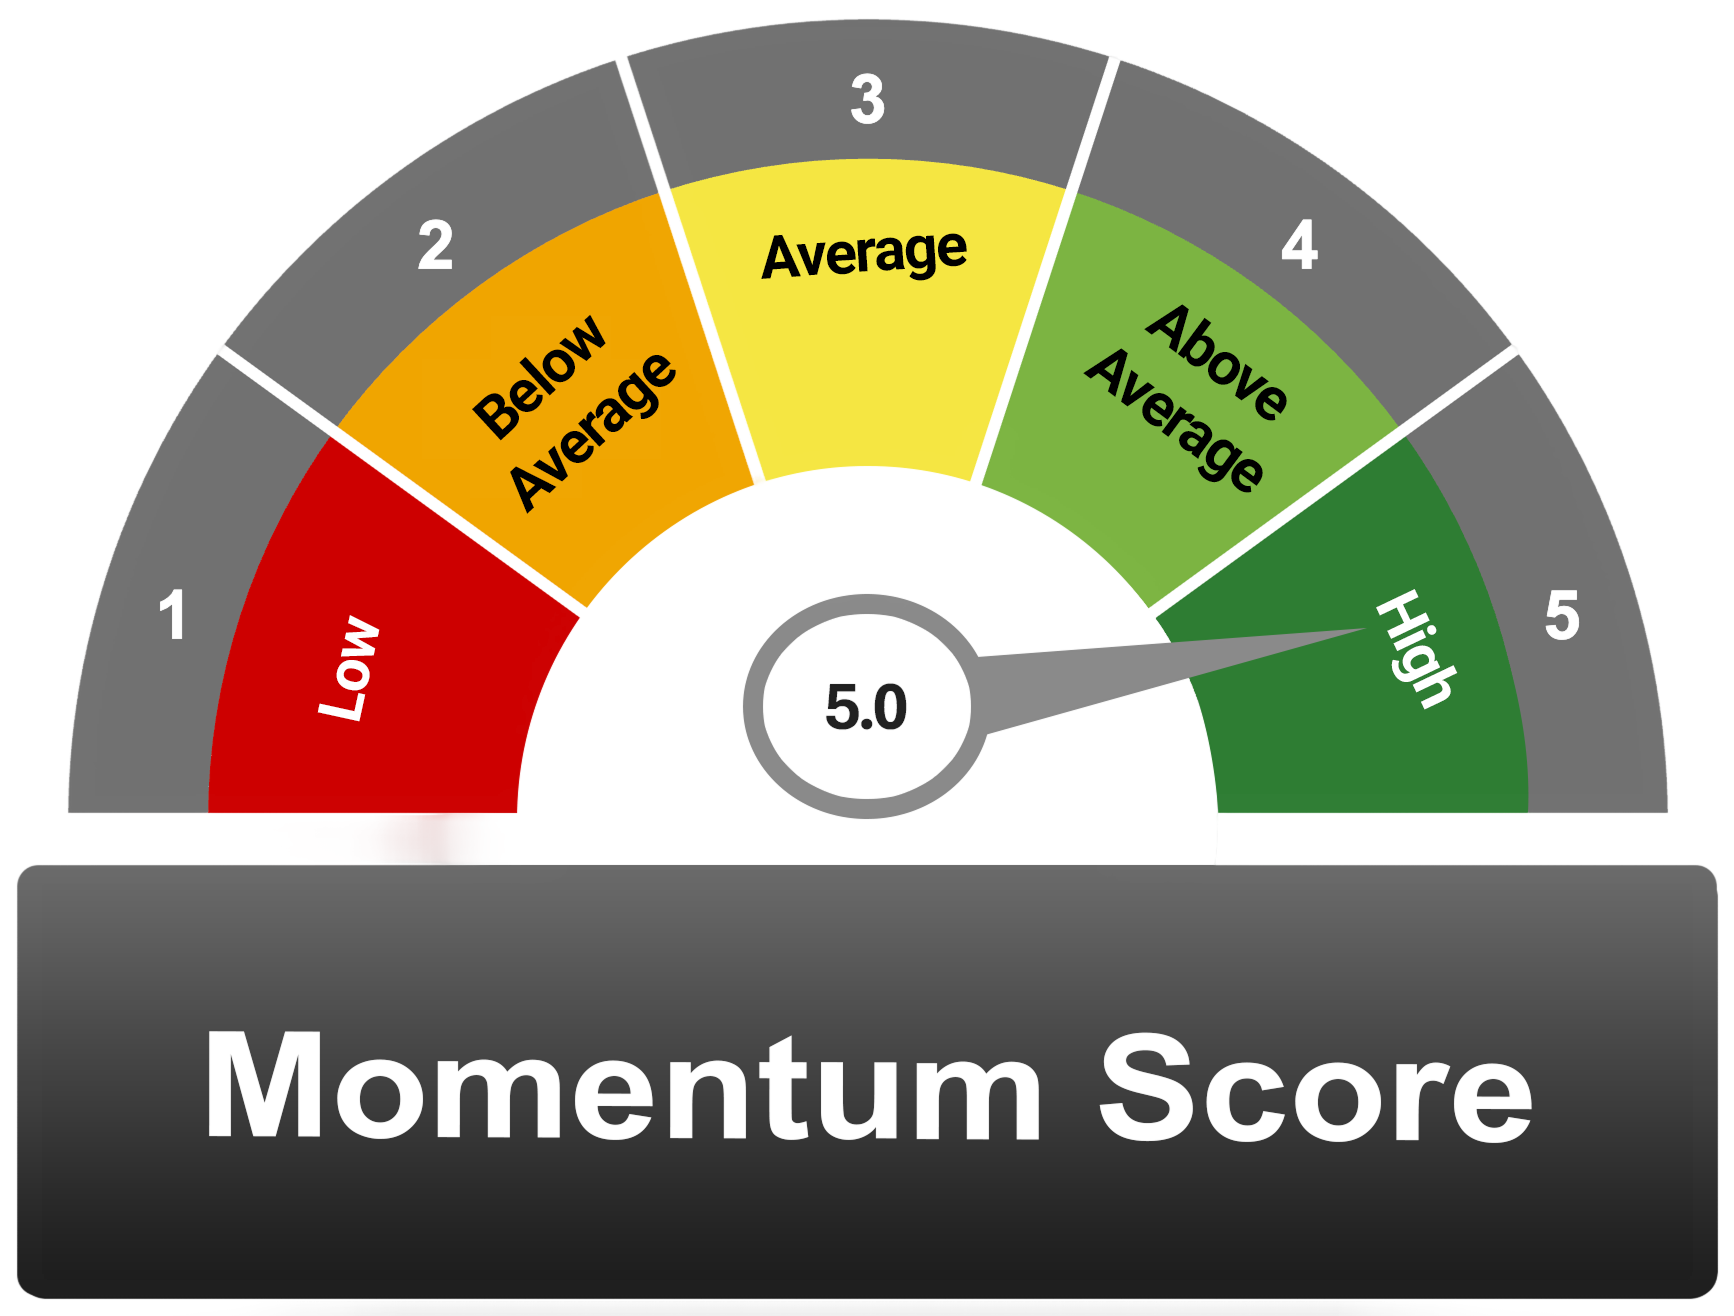
Data Source: REFINITIV, Analysis: Kalkine Group; Note: Momentum score is based on certain criteria’s been met for technical indicators such as Relative Strength Index (RSI), Simple Moving Average (SMA), Parabolic SAR, Direction Movement Index (DMI) and MACD Histogram.