
Highlights
- Nelco Ltd (NSE: NELCO) surged 12.90% to ₹760.45 after touching an intraday high of ₹766.85.
- The stock is trading sharply above its 21-day SMA of ₹608.55, indicating a major improvement in momentum.
- Nelco reported a standalone net loss of ₹57.00 lakh for the December 2025 quarter.
Overview
Nelco Ltd (NSE: NELCO) jumped 12.90% to ₹760.45 after opening at ₹680.95 and extending gains throughout the session. The move has pushed the stock to its highest level in several months and placed it among the strongest performers in the broader market.
The latest rally follows a sharp rebound from the April low near ₹505.00. After remaining under pressure for much of the past few months, Nelco has suddenly regained momentum and broken above a key trading range.
Fundamental View
For the quarter ended December 2025, Nelco reported standalone total income of ₹5,023.00 lakh.
The company remained marginally loss-making during the quarter. Profit before tax stood at a loss of ₹70.00 lakh, while net loss came in at ₹57.00 lakh. Earnings per share was negative at ₹-0.25.
Although the latest quarterly numbers remain weak, the market appears to be focusing more on the sharp improvement in price action and the possibility of a broader turnaround.
Technical View
Nelco is trading near ₹760.45 and remains comfortably above its 21-day Simple Moving Average of ₹608.55. The wide gap between the current price and the moving average highlights the strength of the recent rebound.
The chart shows that the stock formed a base near ₹505.00–550.00 before beginning a strong recovery. The latest move above the earlier swing zone near ₹680.00 has accelerated the rally and changed the short-term structure decisively.
The 14-day RSI has climbed to 74.06, indicating that momentum has become stretched in the near term. While the broader trend has turned positive, such elevated RSI readings can often lead to brief consolidation or profit-booking after a sharp rally.
Key Technical Levels
The ₹710.00–675.00 region may now act as the first important support zone if the stock witnesses some cooling after the recent surge. Holding above this area would keep the current breakout structure intact.
On the upside, the next major zone to watch is around ₹825.00–900.00. If Nelco continues to hold above ₹760.00, the stock may attempt to move toward this higher range over the coming sessions.
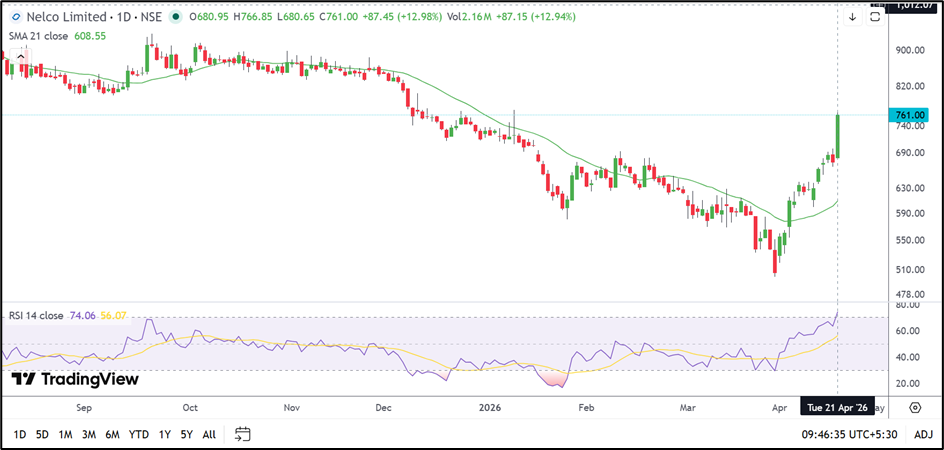
Source: TradingView
Risks to Watch
- The RSI above 74.00 suggests that the stock may be entering an overheated phase.
- The company is still reporting losses, which may limit the sustainability of the rally.
- Sharp rallies are often followed by temporary consolidation or profit-booking.
- A move below ₹675.00 may weaken the recent breakout structure.
Summary
Nelco Ltd (NSE: NELCO) has staged a powerful rebound after breaking above its recent trading range. The stock is now trading far above its 21-day SMA and has become one of the market’s strongest gainers.
However, the rally has become stretched in the short term and the company’s weak earnings profile remains a concern. As long as Nelco holds above the ₹710.00–675.00 zone, the broader recovery may continue.
FAQs
Why did Nelco share price rise today?
Nelco rallied sharply after breaking above its recent trading range and moving to its highest level in several months.
Is Nelco trading above its 21-day SMA?
Yes. Nelco is trading well above its 21-day SMA of ₹608.55.
What are the next key levels for Nelco?
The stock may find support near ₹710.00–675.00, while the next upside zone is seen around ₹825.00–900.00.