
Highlights
- Vineet Laboratories Ltd (NSE: VINEETLAB) jumped 11.10% to ₹40.23 after touching an intraday high of ₹43.45.
- The stock is trading well above its 21-day SMA of ₹31.62, reflecting a strong improvement in momentum.
- Vineet Laboratories reported standalone net profit of ₹85.07 lakh for the December 2025 quarter.
Overview
Vineet Laboratories Ltd (NSE: VINEETLAB) rallied 11.10% to ₹40.23 after opening at ₹37.50 and extending gains through the session. The stock touched an intraday high of ₹43.45 before giving up some gains.
The move has lifted the stock to its highest level in several months and confirmed a decisive breakout from the recent consolidation range near ₹32.00–35.00. After remaining subdued for much of February and March, the stock has suddenly turned sharply higher.
Fundamental View
For the quarter ended December 2025, Vineet Laboratories reported standalone total income of ₹1,569.59 lakh.
Profit before tax stood at ₹81.80 lakh, while net profit came in at ₹85.07 lakh. Earnings per share was ₹0.92.
Although the company remains relatively small, the latest quarterly numbers show that it continues to operate profitably. The return to profit has added support to the recent rally in the share price.
Technical View
Vineet Laboratories is now trading comfortably above its 21-day Simple Moving Average of ₹31.62, which suggests that the near-term trend has strengthened considerably.
The latest breakout above the earlier swing zone near ₹36.00 has changed the chart structure. The stock had spent several weeks moving sideways before the current surge pushed it into a fresh higher range.
The 14-day RSI has climbed to 81.27, indicating that momentum has become extremely stretched in the short term. Such elevated RSI readings often lead to brief consolidation or profit-booking after a sharp rally.
Despite this, the broader structure remains positive as long as the stock stays above the recent breakout area.
Key Technical Levels
The ₹37.25–33.00 region may now act as the first important support band if the stock witnesses some cooling after the recent surge. Holding above this range would keep the present breakout structure intact.
On the upside, the next zone to watch is around ₹44.00–49.00. A sustained move above ₹44.00 may allow the rally to extend further toward the upper end of this range.
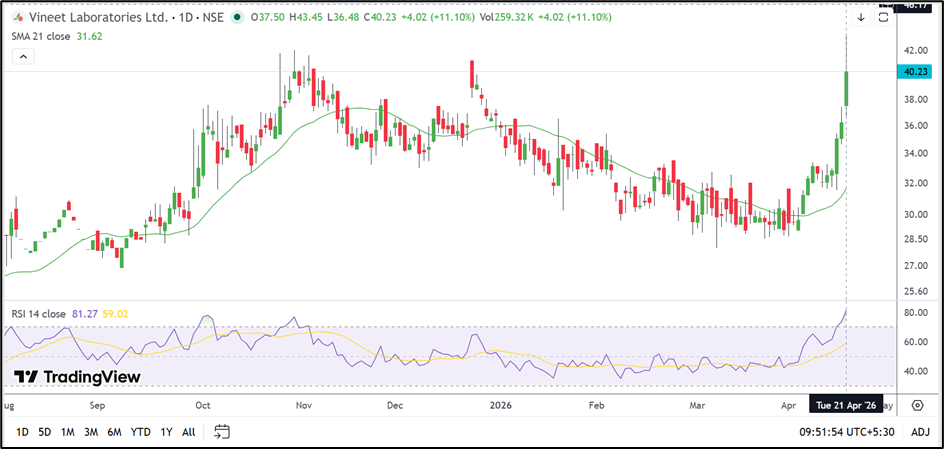
Source: TradingView
Risks to Watch
- The RSI above 80.00 suggests that the stock may be entering an overheated zone.
- Sharp rallies in low-volume stocks can often be followed by quick profit-booking.
- The stock touched ₹43.45 intraday but failed to hold that level, indicating some near-term supply.
- A move below ₹33.00 may weaken the current recovery structure.
Summary
Vineet Laboratories Ltd (NSE: VINEETLAB) has delivered a sharp breakout after weeks of consolidation and is now trading at its highest level in several months. The stock is supported by profitable quarterly numbers and a much stronger chart structure.
However, the rally has become stretched in the near term, with RSI moving above 80.00. If the stock remains above ₹37.25–33.00, the broader upward trend may continue.
FAQs
Why did Vineet Laboratories share price rise today?
The stock surged after breaking above its recent trading range and moving to a multi-month high.
Is Vineet Laboratories trading above its 21-day SMA?
Yes. The stock is trading well above its 21-day SMA of ₹31.62.
What are the next key levels for Vineet Laboratories?
The stock may find support near ₹37.25–33.00, while the next upside zone is seen around ₹44.00–49.00.