

Highlights
- Panacea Biotec shares declined over 7% after a sharp rally to fresh highs.
- The stock remains well above its 50-day SMA despite the latest correction.
- Recent quarterly results showed a marginal net loss, keeping fundamentals in focus.
Overview
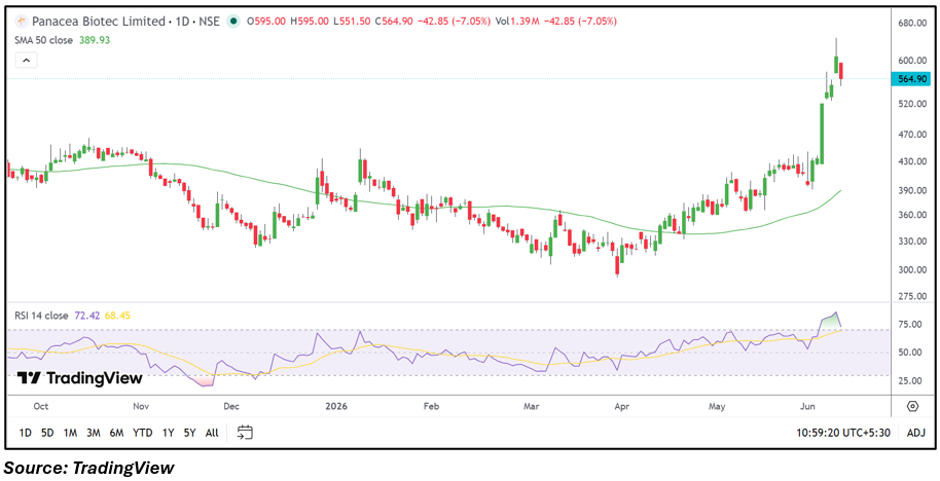
Panacea Biotec (NSE: PANACEABIO) shares came under pressure on June 10, falling around 7% to ₹564.90 after touching a recent high of ₹595.00 during the session. The decline follows a powerful rally over the past few weeks that pushed the stock to multi-month highs. Given the sharp run-up, the latest move appears to reflect profit booking and volatility rather than a major change in the broader trend.
Fundamental View
For the quarter ended March 2026, Panacea Biotec reported standalone total income of ₹11,672 lakh. The company posted a loss before tax of ₹461 lakh and a net loss of ₹18 lakh, with earnings per share at -₹0.03. While revenue remained sizeable, investors may continue to monitor the company's ability to improve profitability in the coming quarters.
Technical View
Panacea Biotec is trading at ₹564.90, down 7.05% for the session. Despite the correction, the stock remains comfortably above its 50-day SMA of ₹389.93, indicating that the broader price structure remains positive. The recent rally pushed the stock into overextended territory, and the latest decline suggests some cooling after a rapid advance. The RSI stands at 72.42, remaining above the overbought threshold, which points to elevated momentum but also increases the possibility of near-term volatility. As long as the stock holds above key medium-term trend levels, the broader structure remains constructive despite short-term weakness.
Momentum Indicator
The 14-day RSI is around 72.42, staying above the 70 mark. This reflects strong momentum following the recent rally, though it also indicates that the stock has entered an overbought zone where corrective moves and consolidation phases can emerge.
Key Technical Levels
From a technical standpoint, immediate support is seen near ₹536.66, followed by a stronger support zone around ₹508.41. On the upside, resistance is positioned near ₹593.15, while the next major hurdle is around ₹621.39. Price action around these levels could influence the stock's near-term direction following the recent pullback.
Key Risks to Watch
- Recent rally may trigger further profit booking.
- Loss-making quarter could affect sentiment.
- ASM surveillance status may increase volatility.
- Overbought RSI may lead to short-term consolidation.
Summary
Panacea Biotec shares corrected after a significant rally that pushed the stock to fresh highs. While the latest decline reflects profit booking pressure, the stock continues to trade well above its 50-day SMA, indicating that the broader trend remains intact. Investors may watch whether the stock stabilizes near support levels and how momentum indicators behave after exiting overbought territory.
FAQs
- Why did Panacea Biotec shares fall today?
The stock corrected after a sharp rally, with profit booking and elevated volatility contributing to the decline. - Is the broader trend still positive for PANACEABIO?
The stock remains above its 50-day SMA, suggesting the broader trend remains positive despite the correction. - What should investors monitor next?
Investors may track support levels, RSI behaviour, and future earnings performance for signs of trend continuation.