
Highlights
- The stock has surged sharply above its 50-day SMA, indicating a potential trend reversal.
- RSI signals overbought conditions, suggesting stretched momentum after the recent rally.
- Resistance levels ahead may lead to consolidation following the steep upward move.
Tokyo Plast International (NSE:TOKYOPLAST) is trading near INR 106.80, reflecting a gain of around 20.00% in the latest session. The stock has moved decisively above its 50-day simple moving average at INR 82.33, indicating that the broader structure is attempting a reversal after a sustained downtrend. The sharp rally has pushed prices to the upper band level of INR 106.80 during intraday trade.
The recovery follows a rebound from the 52-week low of INR 53.86 recorded in March 2026. However, the steep upward move suggests that near-term consolidation or mild pullback may occur. Immediate support is placed in the INR 90.00–82.00 zone, while resistance is seen between INR 115.00 and INR 125.00.
Momentum Indicators Reflect Overbought Conditions
The 14-day Relative Strength Index (RSI) stands near 77.03, indicating overbought conditions and stretched momentum in the short term. This reflects strong buying activity but also increases the likelihood of consolidation or cooling in prices.
The intraday price range between INR 93.61 and INR 106.80 highlights elevated volatility. The VWAP at INR 103.27 indicates that current trading levels remain above average traded prices, supporting the upward bias. Daily volatility stands at 3.16, while annualised volatility is at 60.37, pointing to significant price swings.
Returns Show Strong Short-Term Outperformance
Tokyo Plast has delivered notable short-term returns, rising 42.76% over the past week compared to 0.97% in NIFTY 50. On a one-month basis, the stock has gained 47.64%, significantly outperforming the broader market.
However, longer-term returns remain mixed. The stock has declined 14.73% over the past year, while year-to-date performance stands at -3.78%. Over three and five years, returns are 12.96% and 52.46% respectively, trailing benchmark performance over longer durations.
Trading Activity and Liquidity Trends
The stock recorded traded volume of 5.84 lakh shares, translating into a traded value of INR 6.03 crore. The total market capitalisation stands at INR 101.47 crore, with free float market cap at INR 26.77 crore.
The impact cost of 1.71 indicates relatively lower liquidity, which may amplify price swings. Deliverable quantity stands at 27.99%, suggesting a moderate level of delivery-based participation.
Technical summary
Tokyo Plast International Ltd. is trading near ₹106.80, up around 20.00%, and has moved sharply above the 50-day SMA near ₹82.33, with the 14-day RSI near 77.03 indicates overbought conditions, pointing to stretched momentum in the short term. Immediate support is placed in the ₹90.00–82.00 zone, while resistance is seen near the ₹115.00–125.00 range.
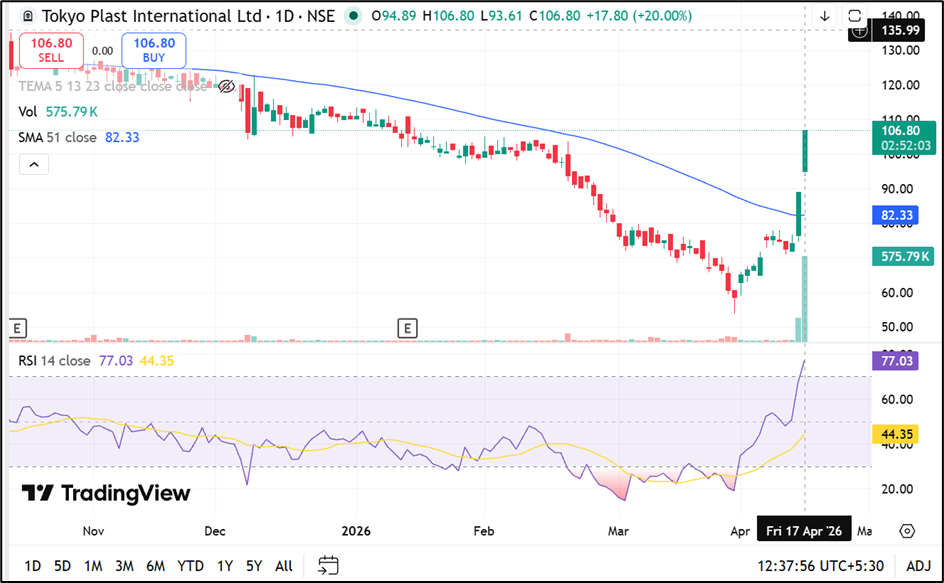
Source: TradingView
Key Risks to Monitor
- Overbought RSI may trigger short-term correction or sideways movement.
- Resistance zone near INR 115–125 could limit further upside momentum.
- Low liquidity may amplify volatility during market fluctuations.
- Sharp rally increases probability of profit booking pressure.
Summary
Tokyo Plast International Ltd. has witnessed a sharp rally, crossing its 50-day SMA and indicating a potential reversal from its previous downtrend. However, overbought momentum and resistance levels ahead suggest that the stock may consolidate in the near term. While short-term returns remain strong, volatility and liquidity conditions may influence price movement going forward.
FAQs
What does the breakout above the 50-day SMA indicate?
It suggests a potential trend reversal, indicating recovery after a prolonged downtrend phase.
Why is RSI above 77 considered important?
It signals overbought conditions, meaning the stock may consolidate or see a short-term correction.
What are the key support and resistance levels?
Support is placed at INR 90–82, while resistance is observed between INR 115 and INR 125.